

Can you run multiple A/B tests at the same time?
You can and should run A/B tests at the same time. Independent randomisation means one experiment's effect is spread evenly across the other's groups, so each can still be read on its own. Interactions between experiments are real but rare, and a platform that checks for them lets teams run far more experiments than a policy of avoiding overlap ever will.
Is it safe to run A/B tests at the same time?
Yes. You can run many experiments at once, on the same users, and still learn from each one independently. In my view, overlapping experiments should be the default, and keeping experiments apart should be the exception you have to justify.
That is not how most companies feel about it. The worry that concurrent experiments will interfere with each other, ruin the sample or make the results meaningless is one of the most common things I hear, and I have heard it from businesses of every size. Even more common is the experimentation practitioner who knows overlap is fine, but works somewhere where everyone else, especially leadership, is nervous about it, and can't get the point across.
I think this fear is a major blocker to a valuable experimentation programme. Volume is a necessary input to learning quickly, and you can't get volume if every experiment has to wait for the last one to finish. This guide is my attempt to explain why overlap is safe, where the real risks are, and how a platform should handle them.
Why are teams afraid of overlapping experiments?
The reasons usually come down to a handful of intuitions. Running experiments at the same time means you can't tell which one caused what. They will interfere with each other. They will contaminate each other's samples and eat into your statistical power. Taken together, they seem to defeat the whole point of running a controlled experiment.
These intuitions are wrong, with one exception. Experiments can interact, and that turns out to be both rarer and more useful than people expect. The caution behind the intuitions is reasonable, though. Most teams have no way to tell whether two experiments are interfering, so avoiding overlap is the only control they have. I'll come back to that at the end, because I think it is the real root of the problem.
Why does randomisation make concurrent experiments safe?
Independent randomisation is what makes this work. If experiment A and experiment B each assign users at random, independently of each other, then A's control group and A's variant group each contain the same mix of B's users. Half of them saw B's control, half saw B's variant, in both of A's groups. Whatever B does to a metric on its own, it does equally to both sides of A, so it cancels out when you compare them. The comparison itself only breaks when the two experiments stop being independent, either because one changes who reaches the other or because their assignments are tangled together. When the combination of the two does something neither does alone, A's comparison is still fair, but what it measures is A averaged over B's mix. All three cases are covered below.
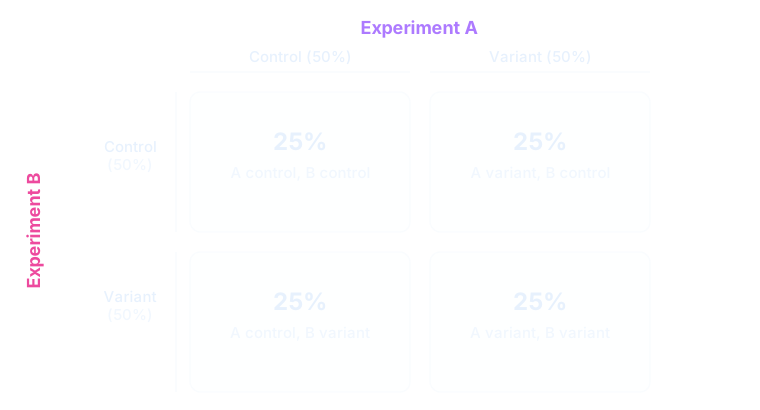
This is the same logic that makes a single experiment work in the first place. Randomisation balances everything you didn't control for, from device type to time of day to what else is happening in the product. A second experiment is one more thing being balanced, no different from a campaign or a release that happens to be running at the same time, as long as the two experiments are randomised independently.
Two details. First, this balance holds on average, not exactly, in the same way that a 50/50 split is never exactly 50/50. With a sensible sample size the imbalance is negligible, and it is already accounted for in the statistics. Second, the balance depends on the randomisation genuinely being independent. When it isn't, you have a problem, and it is one of the types of interaction I describe below.
Concurrent experiments also don't reduce your statistical power. Every user in experiment A is still a user in experiment A, whatever else they are in. Keeping experiments apart is what costs power, and the numbers are worth seeing.
What does running A/B tests one at a time cost?
More than people think. The usual alternatives to overlapping are running experiments one after another, or splitting traffic so that each experiment gets its own exclusive share of users. Both have the same effect: each experiment sees fewer users per week, so it takes longer to reach a conclusion, and you run fewer experiments in a year.
The arithmetic is unforgiving. If three teams each want to run an experiment that needs four weeks of full traffic, running them one at a time takes twelve weeks. Splitting traffic three ways gives each experiment a third of the users, so each one takes about twelve weeks anyway. Running them concurrently takes four. The difference compounds across a year, and it compounds in the backlog too. Teams that have to queue for traffic stop proposing experiments.
Set that against the risk being avoided. As the next two sections show, interactions are rare, and the ones large enough to change a decision show up in the metrics of the experiments involved. Giving up two thirds of your learning to avoid a rare, detectable problem is a bad trade.
Can concurrent A/B tests interfere with each other?
Experiments can interact, and that is the grain of truth in the fear. The classic example: one experiment changes a button's background colour to pink, and another changes the text on that button to the same pink. Each change is harmless on its own. Users who get both can't read the button at all. Even though both experiments were randomised properly, the combination creates a new experience that neither experiment set out to test, and it hurts the metrics.
This is a negative interaction, and it is what people picture when they worry about overlap. It is a real thing, and I'll explain how to catch it. But two points get lost.
The first is that interactions like this come from making changes at the same time, and that happens constantly whether or not anyone is experimenting. Your experiment is interacting with the release that went out last Tuesday, with the campaign marketing launched this morning, with the price change your competitor made, and with the change the team down the hall shipped without testing. Trying to perfectly isolate small changes from each other is not how the world works. Every change lands in a product full of other changes.
The second is that running experiments concurrently gives you a chance to see those interactions. When two changes are both running as experiments, you have randomised groups who got each one alone and both together, and you can measure what the combination does. When one of them is an untested release, you can't. An interaction between two experiments is a learning opportunity you would otherwise have missed.
That comes with a caveat. The opportunity is only real if you can identify interactions when they happen. That is the second half of this guide.
How rare are interactions between experiments?
Rare. The large experimentation orgs that have published on this say the same thing.
- Bing, as far back as 2013, was running over 200 concurrent experiments, with most users in more than 15 at once, and wrote that "interactions are relatively rare and more often represent bugs than true statistical interactions".
- Microsoft more recently checked every pair of experiments running on one day across four products. Three products showed no interactions at all. The fourth showed them in 0.002% of experiment-pair metrics, and none of those was an effect significantly reversing direction. They titled the write-up "A call to relax".
- Thirteen organisations, Airbnb, Amazon, Booking.com, Facebook, Google and Netflix among them, agreed in 2019 that "it is rare that two interacting experiments cause enough contamination that it changes the ship decision", and that the risk is highest when one team is changing the same part of the product.
- Overlapping by default is the norm at this scale. LinkedIn's write-up puts it plainly: most experiments touch entirely different parts of the product and are unlikely to interact.
- Booking.com runs more than a thousand experiments at any one time, and has made the point that isolating tests doesn't remove interactions. It means you have no idea what happens when both changes go live.
My experience inside some of these companies, and others, matches this. I have built and run platforms where tens of thousands of experiments ran per year on a single platform, with hundreds or thousands running at any one time, and genuine interactions were a small fraction of what we checked. The fear of them is much stronger than the reality.
Two caveats. First, rarely detected is not quite the same as rare. Interactions are harder to detect than main effects, and Microsoft's own write-up says it may have missed some for lack of power. Second, these programmes do keep experiments that change the same thing apart, so some of the rarity comes from that discipline. One academic study of an e-commerce platform found a large share of co-occurring experiments with statistically significant interactions, which is the strongest counter-evidence I know of. It is one study, but it is a reminder that how rare interactions are depends partly on how you organise your experiments.
Both caveats point to the same conclusion. Keep experiments that touch the same element apart, let everything else overlap, and have a system that checks.
What are the types of interaction?
Most people have one picture of an interaction, the pink button. Several distinct things can go wrong, or right, when experiments overlap, and they need different checks. I group them into two families: traffic interactions and metric interactions.
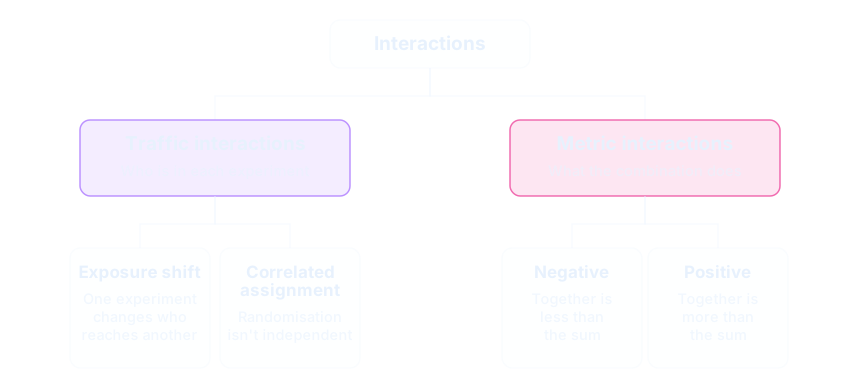
What are traffic interactions?
One experiment changes which units are in another, or which group they land in. There are two ways that happens, and both can be checked automatically.
It helps to start with what we expect. With two independent experiments, users from each of A's groups split evenly across B's groups, so every combination holds a quarter of the shared users. The two types of traffic interaction are two different ways that picture goes wrong.
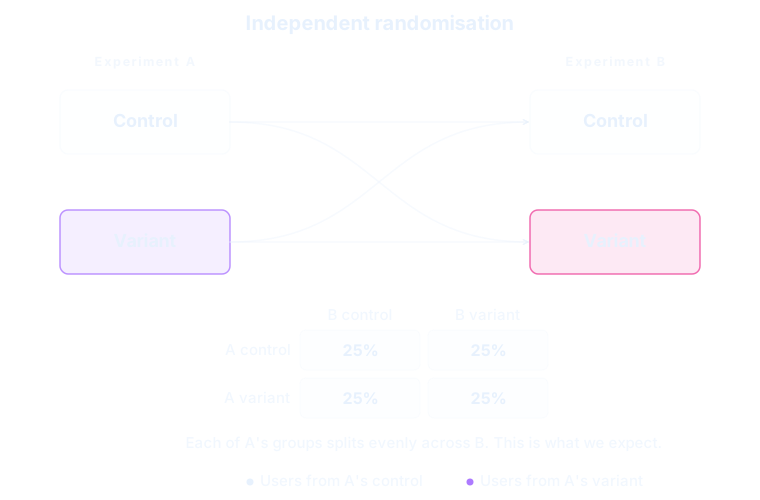
Exposure shift: one experiment changes who reaches another
An exposure shift is when one experiment changes how many users reach another, or which users do.
Say experiment A makes the add-to-cart button more prominent on the product page, and experiment B runs on the cart page. A's variant sends more users to the cart, so more of them reach B. They are also different users, more hesitant buyers nudged along by a bigger button. At the extreme, only A's variant reaches B at all. That happens whenever B lives somewhere that only A's variant introduces, such as a new step in checkout.
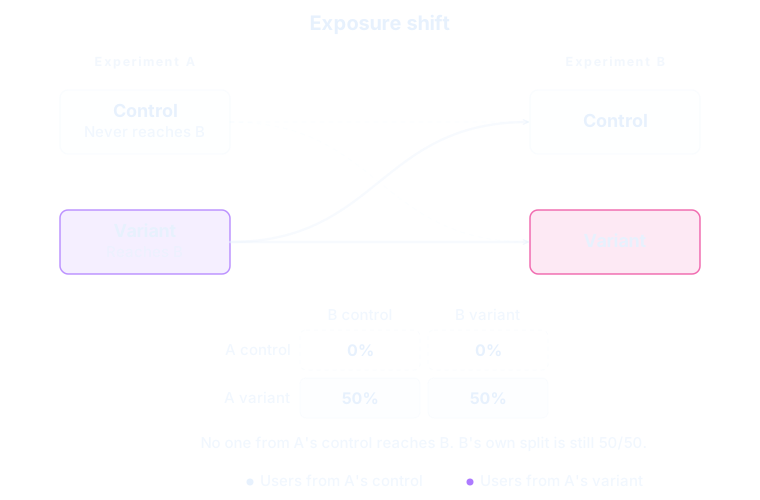
The cart experiment, B, is still randomising properly, but the group of users reaching it is skewed by experiment A. Its result describes the people a bigger button sent to the cart, and that group changes again when A ships or is switched off.
The product page experiment, A, is affected too. Its variant sends more people through B, so B's effect lands more on A's variant than on A's control and leaks into A's result. This is where the "it cancels out" argument from earlier fails. It only holds when both of A's groups reach B at the same rate.
You spot it by comparing how many users enter B from each of A's groups. If A's variant sends more than A's control, you have an exposure shift and you know which experiment is causing it. It is usually fine to keep both running. Read each experiment's result within the other's groups and decide whether the difference matters.
Correlated assignment: randomisation that isn't independent
Correlated assignment is when two experiments' randomisations are tied together. Users in A's control are more likely to land in B's control, or in B's variant, than chance alone would put them. Everything above relies on this not happening.
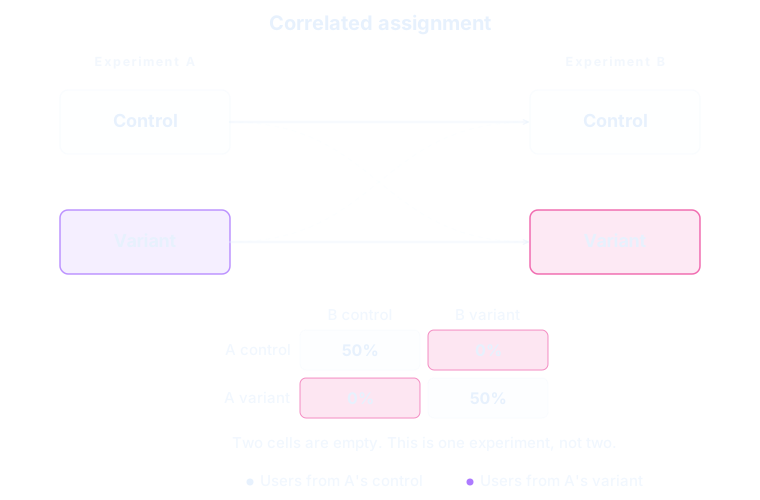
It happens for mundane reasons. Two experiments were set up with the same randomisation key or salt. A bucketing system reused buckets that another experiment was still using. A randomisation engine that wasn't built for many overlapping experiments quietly correlated them. Someone copied an experiment's configuration and didn't change the part that mattered.
What this does to your results is not subtle. You are no longer running two experiments. You are running one experiment with a muddled set of treatments, and neither result can be read on its own. In the diagram above, A's variant and B's variant are the same people, so there is no way to say which change moved the metric.
You spot it by looking at how B splits inside each of A's groups. Under independence, B splits the same way in A's control as in A's variant, however many users each group sends. That is what separates this from an exposure shift. In the exposure shift diagram the rows are unequal but each one still splits 50/50. Here they don't. A meaningful difference in B's split between A's groups is a correlated assignment. Treat it like a sample ratio mismatch: stop, and fix the setup.
What are metric interactions?
A metric interaction is when the combination of two variants does something to a metric that differs from the sum of what each does alone. There is nothing wrong with the traffic. The groups are clean and the randomisation is independent. The issue is that users who get both variants are having a new experience.
The baseline is additivity. If experiment A lifts conversion by one percentage point on its own and experiment B lifts it by two points on its own, then with no interaction, users who get both see a three point lift. Anything other than three points is an interaction. In practice we usually mean an interaction large enough to matter, since tiny departures from additivity are everywhere and not worth acting on.
An interaction can run in one of two directions.
- Negative interactions. The combination is worth less than the sum of the parts. The pink button is the extreme case, where two harmless changes produce a broken experience. Much milder versions are common: two changes that pull on the same lever, like two ways of reducing friction on the same step, overlap a little, so together they deliver somewhat less than the sum.
- Positive interactions. The combination is worth more than the sum. A new recommendation algorithm and a redesigned recommendation widget might each be modest wins, and together be a large one, because the better recommendations finally have room to show. In my experience positive interactions are rarer, but they are just as possible, and they teach you something you would never have learned from either experiment alone.
The direction of an interaction is not the same as the outcome
People hear "negative interaction" and picture two changes that produce a bad result together. But the direction of an interaction only says how the combination compares with the sum of its parts. The outcome is whether the combination is a win, neutral or a loss overall. Those are two different questions, and every pairing of them exists.
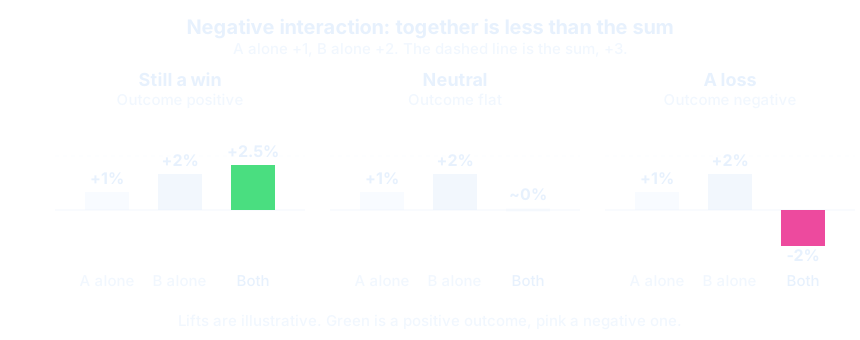
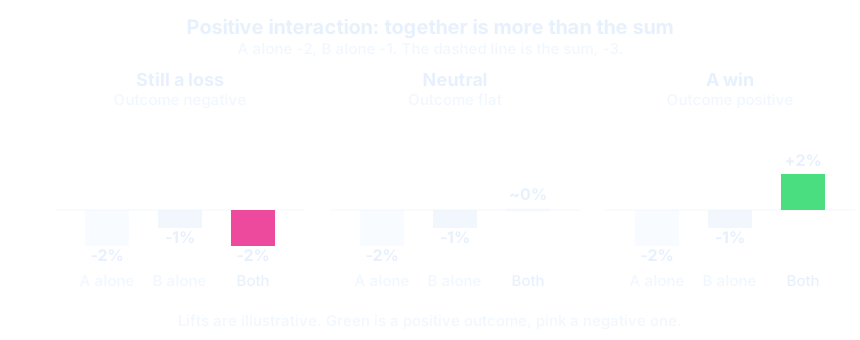
A negative interaction doesn't mean the combination is worth less than either part alone, and it certainly doesn't mean you shouldn't ship both. Take two experiments that each lift conversion by two points on their own.
| Both together | Interaction | What it means | Best decision |
|---|---|---|---|
| +4% | None | The effects add up | Ship both |
| +3% | Negative | Diminishing returns, still the best option | Ship both |
| +1.5% | Negative | Together is worse than either alone | Ship one |
| -1% | Negative | The combination breaks something | Ship one, and find out why |
Only the last two rows change what you do, and only the last is the pink button. The second row is the most common kind of negative interaction. It is diminishing returns, and it is expected, mildly interesting, and no reason for alarm.
The same nuance runs the other way. Two experiments that each lose a little, with a positive interaction between them, might lose less together than you'd expect and still be a loss. They might come out neutral. Occasionally they turn into a win, because the combination makes something work that neither change did alone. Positive is usually good news, but it isn't a guarantee.
The same distinction clears up a case people often describe as a third type: two changes that cancel each other out. A neutral result is an outcome, and it can come from three places. It can come from a negative interaction between two winners, in which case ship one of them. It can come from a positive interaction between two losers, in which case ship neither. And it can come from a winner and a loser with no interaction at all. The label tells you nothing until you look at the four cells.
So the useful question is "which of the four combinations is best, and how sure are we?" A detection system that only raises a flag leaves you to work that out yourself. One that shows you the four cells, with the uncertainty around each, lets you make the decision directly.
There is more. Interactions can involve three experiments, appear in one metric or segment and not another, look different on a relative scale and an absolute one, or emerge late. Those are for another guide. The main types are above, and most of them are manageable.
How do you detect interactions?
Each type has a specific check, and in principle any of them can be run on any pair of running experiments. The two traffic checks are described above: arrival rates into B by A's variants for exposure shift, and B's split within each of A's groups for correlated assignment.
The metric check treats each pair of experiments as a two by two factorial design and tests whether the effect of one variant differs depending on the other. This is the same calculation as a segmented result, where the segment is the other experiment's variant. How well it works depends on the allocations: two 50/50 experiments give you a both-variants cell holding a quarter of users, while a 90/10 experiment overlapping a 50/50 one leaves that cell with one user in twenty.
There are two limits. Detecting an interaction needs more data than detecting a main effect, because you are comparing differences of differences in smaller groups. The standard error of an interaction is roughly twice that of a main effect, so an interaction the same size as a main effect needs about four times the sample, and a smaller one needs far more. In practice this means the interactions large enough to change a decision show up within days, smaller ones take longer or go undetected, and the small ones rarely matter. And checking many pairs means some apparent interactions will be noise, so the thresholds need to be conservative and the findings treated as prompts to investigate, not verdicts.
How does Cherto handle interactions?
Most experimenters don't have any of these checks. Their platform runs each experiment as if it were alone, and the only way to find an interaction is to notice something odd in the results and go digging. In that situation, nervousness about overlap is justified, even if interactions are rarer than people think. Caution is the only tool available.
We built interaction monitoring into Cherto from the start so that teams can overlap by default, run every experiment that isn't changing the same thing as another, and be told when something needs a look, whether that is a problem or an opportunity.
In practice that means:
- Monitoring across running experiments. Cherto monitors live experiments for the traffic and metric interactions above, as part of the same analysis runs that produce your results. By default that is daily, and teams control how often analyses run.
- Early checks at launch. The first hours of an experiment are when correlated assignment and exposure shifts show up. Where the setup allows it, we check for them early rather than waiting for the first scheduled analysis.
- A pointer to the pair. When something is found, Cherto points to the pair of experiments involved and the type of interaction, so you can see whether it needs action and whether it is good or bad news.
- Anticipating interactions before launch. Before an experiment goes live, Cherto looks at what is already running and flags where an interaction is plausible. That gives teams a prompt to check in with each other before anything launches, which is often all the coordination that is needed.
Running every one of these checks on every pair of running experiments would be wasteful. The number of pairs grows with the square of the number of experiments, the metric checks need a factorial breakdown for each one, and the great majority of pairs have no realistic way to interact. So Cherto doesn't do that. It works out where an interaction is plausible and where an analysis is worth running, and focuses the heavier checks there. I won't go into how that funnel works, but the reason for it matters. Because Cherto is warehouse-native, these queries run in your warehouse, on your bill, and we take being a good citizen there seriously. Interaction monitoring is one of the places where that discipline matters most.
Interactions have more forms than any guide can cover, and I'd rather teams didn't have to hold all of them in their heads. The point of building this into the platform is that they don't need to.
Why is detection a better trade than avoidance?
Because the two things being traded are so unequal. On one side is the learning velocity of your whole programme: how many experiments you run, how quickly they conclude, and how willing teams are to propose them. On the other is a rare chance of a harmful interaction. The ones large enough to matter surface within days on a platform with the right checks, and you can stop them as soon as they are found. The ones too small to surface quickly are, almost by definition, too small to change a decision.
Avoidance pays the velocity cost on every experiment to protect against a problem that almost never occurs. Detection pays little up front and handles the rare problem when it arrives. It also turns the occasional interaction into something you learn from, including the positive ones you would never otherwise have seen.
The second benefit has nothing to do with statistics. Earlier I mentioned the practitioner who knows overlap is fine but can't convince leadership. Telling a worried executive that interactions are rare settles nothing, because rare is not never. A system that catches the rare ones, and shows everyone it caught them, does. The first time it flags a real interaction and the team deals with it within a day, the fear goes out of the conversation. After that, overlapping is how experiments are run, and teams stop asking permission to do it.
I would make that trade any day.
Common questions
Should experiments ever be mutually exclusive?
Occasionally. If two experiments change the same element in ways that can't coexist, such as two redesigns of the same checkout step, running them together tests combinations nobody intends to ship. Keep those apart. This is how the largest programmes work: Google's platform groups experiments into layers so that ones changing the same parameters are exclusive and everything else overlaps, and Bing's uses declared constraints to stop conflicting experiments running together. The mistake is making exclusion the default for experiments that merely share a page or a user, which is nearly all of them.
Do concurrent experiments reduce statistical power?
No. Every experiment still sees all of its traffic. Splitting traffic between experiments so that they don't overlap is what reduces power.
What should I do if an interaction is detected?
It depends on the type. Correlated assignment means the randomisation is broken, so stop and fix the setup. An exposure shift is usually fine to continue with, but read the downstream experiment's result with the upstream one in mind. A metric interaction, in either direction, means looking at all four combinations rather than each experiment alone, and shipping whichever is best. Often that is still both, even when the effects don't fully add up. Sometimes it is one, and occasionally neither. Either way, a confirmed interaction is a finding about your product. Write it down.
Isn't it safer to just run one experiment at a time?
It feels safer, but it isn't. Your product changes constantly whether or not you are testing, so a single experiment is never truly isolated. Running experiments one at a time gives up most of your learning for an isolation you don't actually get.